
CONTACT US
SEARCH WHAT YOU WANT
Facility managers across manufacturing plants, retail complexes, and logistics hubs face a shared pressure: cleaning budgets rise while staffing stays flat. Robotic cleaning system cost savings offer a measurable response — not a speculative promise. Autonomous floor-cleaning units now handle tasks that once required dedicated shift teams, at a fraction of recurring labor expense.
The economics work because these machines do more than replace mops. They cut chemical waste, extend floor life, and compress cleaning cycles into predictable, data-tracked schedules. For facilities managing 50,000+ square feet, the compounding monthly savings are substantial.
Cost reductions from autonomous cleaning fall into four distinct categories. Each impacts the operational budget differently, and understanding the breakdown helps teams prioritize deployment.
In large-volume production environments, these categories interact. A warehouse running three cleaning shifts can often eliminate one full shift after deployment. The remaining two shifts handle edge work and spot cleaning while the robot covers open-floor routes.

Labor typically accounts for 60–70% of total facility cleaning costs. This makes it the highest-leverage area for robotic intervention. A single autonomous unit operating 8–12 hours per shift can replace the output of 2–3 manual cleaners on open floor areas.
The math is straightforward for high-traffic facilities. Consider a 40,000 ㎡ distribution center:
|
Cost Factor |
Manual Cleaning (3 shifts) |
Robotic + Manual Hybrid |
|
Annual labor cost |
~$180,000–240,000 |
~$90,000–120,000 |
|
Chemical / consumables |
~$18,000 |
~$12,000–14,000 |
|
Equipment maintenance |
~$8,000 |
~$10,000–12,000 |
|
Estimated annual total |
~$206,000–266,000 |
~$112,000–146,000 |
These figures vary by region, wage structure, and facility layout. The pattern holds regardless: robotic cleaning system cost savings concentrate in labor reduction, with secondary gains in consumables and floor maintenance.
Modern commercial cleaning robots use SLAM (Simultaneous Localization and Mapping) navigation. This allows them to map a facility once and follow optimized routes without physical guides or magnetic strips. The result is consistent coverage with minimal overlap.
Three navigation factors directly influence cleaning speed:
For environments with mixed flooring — carpet transitions, expansion joints, ramped loading docks — gradeability matters. Robots rated for 7° inclines or higher can navigate warehouse ramps and dock approaches without operator intervention.
Robotic cleaning systems deliver the strongest ROI in facilities with large, open floor plans and predictable traffic patterns. Three environments stand out:
Warehouses and distribution centers. Dust from forklift tires and pallet movement accumulates rapidly on polished concrete. A robot running overnight keeps the floor clean without competing with daytime operations. Units with 8-hour+ endurance can cover an entire shift zone on a single charge.
Retail and shopping malls. High foot traffic during operating hours demands cleaning before opening or after closing. Robots with noise levels ≤62 dB(A) operate in silent mode without disturbing early-morning stocking crews or overnight security staff.
Manufacturing floors. Production lines generate fine particulates that settle on surrounding walkways. Robotic units with high vacuum power — 15–17 kPa — capture fine dust that standard walk-behind scrubbers leave behind. This is particularly relevant in electronics and food-processing facilities where particulate control affects compliance.
Payback periods for commercial robotic cleaning systems typically range from 12 to 24 months. The exact timeline depends on three variables: floor area, current labor cost per square meter, and robot utilization rate.
A practical ROI calculation follows this structure:
Facilities above 20,000 ㎡ with multi-shift cleaning operations generally see the fastest payback. Smaller sites may need to justify the investment through secondary benefits: improved cleaning consistency, audit-ready cleaning logs, and reduced worker injury claims from repetitive mopping.
Spec-matching is where many procurement decisions go wrong. A robot that excels in a retail atrium may underperform on a dusty warehouse floor. Facility teams should evaluate four core parameters before committing:
Cleaning efficiency. Measured in square meters per hour, this determines how much area a robot covers per shift. A unit rated at 1,600 ㎡/h — such as the AotingBot SW80-A — can cover roughly 12,800 ㎡ in a single 8-hour shift on hard flooring. That suits mid-to-large facilities with open floor plans.
Endurance and charging cycle. Battery capacity sets the practical coverage limit per charge. The SW80-A's 100Ah battery delivers up to 8 hours on hard flooring and 12 hours in silent mode, with a 4-hour charge cycle. This allows two-shift operation with a midday top-up.
Max mapping area. This defines how large a space the robot can memorize in a single deployment. A 40,000 ㎡ mapping capacity — as found on the SW80-A — covers most single-building warehouses and exhibition halls without requiring zone splitting.
Floor compatibility. The best commercial robots handle carpet, hard, and wooden floors without manual adjustment. Edge-cleaning performance and dust containment vary significantly between models, so request site demonstrations on your actual floor type before finalizing.
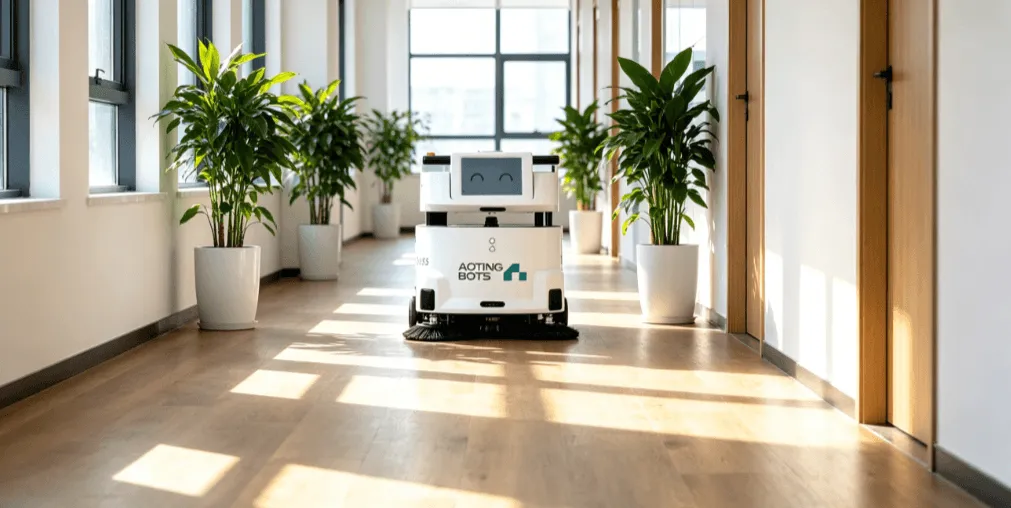
For facilities evaluating robotic cleaning system cost savings, the SW80-A's spec profile — 850 mm cleaning path, 17 kPa vacuum, ≤62 dB(A) noise, multi-floor compatibility — positions it for medium-to-large commercial and industrial applications. Its ability to transition between carpet and hard flooring makes it suitable for mixed-use complexes where floor types change between zones.
How much can a robotic cleaning system save per year?
Annual savings typically range from 40,000 to 120,000 for facilities above 20,000 ㎡, depending on current labor costs and shift structure. The largest savings come from eliminating one or more cleaning shifts.
Do robotic cleaning systems work on all floor types?
Most commercial models handle hard floors, carpet, and wooden surfaces. Performance varies on textured or porous floors. Always verify with a site test, especially for industrial coatings or anti-slip surfaces.
How long does it take to see ROI on a robotic cleaning system?
Standard payback periods fall between 12 and 24 months. Facilities with high labor costs and large floor areas reach break-even fastest. Secondary benefits like audit logs and reduced injury claims improve the effective ROI.
What maintenance do robotic cleaning systems require?
Routine maintenance includes brush replacement, filter cleaning, dustbin emptying, and battery health checks. Most manufacturers offer service contracts. Annual maintenance costs typically run 5–8% of the system purchase price.
Can a robotic cleaning system replace all manual cleaning staff?
No. Robots handle open-floor routes efficiently, but stairs, tight corners, and vertical surfaces still require human cleaners. The most cost-effective model is a hybrid setup where the robot covers large areas and manual staff handle detail work.
Facility managers across manufacturing plants, retail complexes, and logistics hubs face a shared pressure: cleaning budgets rise while staffing stays flat. Robotic cleaning system cost savings offer a measurable response — not a speculative promise. Autonomous floor-cleaning units now handle tasks that once required dedicated shift teams, at a fraction of recurring labor expense.
The economics work because these machines do more than replace mops. They cut chemical waste, extend floor life, and compress cleaning cycles into predictable, data-tracked schedules. For facilities managing 50,000+ square feet, the compounding monthly savings are substantial.
Cost reductions from autonomous cleaning fall into four distinct categories. Each impacts the operational budget differently, and understanding the breakdown helps teams prioritize deployment.
In large-volume production environments, these categories interact. A warehouse running three cleaning shifts can often eliminate one full shift after deployment. The remaining two shifts handle edge work and spot cleaning while the robot covers open-floor routes.
Labor typically accounts for 60–70% of total facility cleaning costs. This makes it the highest-leverage area for robotic intervention. A single autonomous unit operating 8–12 hours per shift can replace the output of 2–3 manual cleaners on open floor areas.
The math is straightforward for high-traffic facilities. Consider a 40,000 ㎡ distribution center:
|
Cost Factor |
Manual Cleaning (3 shifts) |
Robotic + Manual Hybrid |
|
Annual labor cost |
~$180,000–240,000 |
~$90,000–120,000 |
|
Chemical / consumables |
~$18,000 |
~$12,000–14,000 |
|
Equipment maintenance |
~$8,000 |
~$10,000–12,000 |
|
Estimated annual total |
~$206,000–266,000 |
~$112,000–146,000 |
These figures vary by region, wage structure, and facility layout. The pattern holds regardless: robotic cleaning system cost savings concentrate in labor reduction, with secondary gains in consumables and floor maintenance.
Modern commercial cleaning robots use SLAM (Simultaneous Localization and Mapping) navigation. This allows them to map a facility once and follow optimized routes without physical guides or magnetic strips. The result is consistent coverage with minimal overlap.
Three navigation factors directly influence cleaning speed:
For environments with mixed flooring — carpet transitions, expansion joints, ramped loading docks — gradeability matters. Robots rated for 7° inclines or higher can navigate warehouse ramps and dock approaches without operator intervention.
Robotic cleaning systems deliver the strongest ROI in facilities with large, open floor plans and predictable traffic patterns. Three environments stand out:
Warehouses and distribution centers. Dust from forklift tires and pallet movement accumulates rapidly on polished concrete. A robot running overnight keeps the floor clean without competing with daytime operations. Units with 8-hour+ endurance can cover an entire shift zone on a single charge.
Retail and shopping malls. High foot traffic during operating hours demands cleaning before opening or after closing. Robots with noise levels ≤62 dB(A) operate in silent mode without disturbing early-morning stocking crews or overnight security staff.
Manufacturing floors. Production lines generate fine particulates that settle on surrounding walkways. Robotic units with high vacuum power — 15–17 kPa — capture fine dust that standard walk-behind scrubbers leave behind. This is particularly relevant in electronics and food-processing facilities where particulate control affects compliance.
Payback periods for commercial robotic cleaning systems typically range from 12 to 24 months. The exact timeline depends on three variables: floor area, current labor cost per square meter, and robot utilization rate.
A practical ROI calculation follows this structure:
Facilities above 20,000 ㎡ with multi-shift cleaning operations generally see the fastest payback. Smaller sites may need to justify the investment through secondary benefits: improved cleaning consistency, audit-ready cleaning logs, and reduced worker injury claims from repetitive mopping.
Spec-matching is where many procurement decisions go wrong. A robot that excels in a retail atrium may underperform on a dusty warehouse floor. Facility teams should evaluate four core parameters before committing:
Cleaning efficiency. Measured in square meters per hour, this determines how much area a robot covers per shift. A unit rated at 1,600 ㎡/h — such as the AotingBot SW80-A — can cover roughly 12,800 ㎡ in a single 8-hour shift on hard flooring. That suits mid-to-large facilities with open floor plans.
Endurance and charging cycle. Battery capacity sets the practical coverage limit per charge. The SW80-A's 100Ah battery delivers up to 8 hours on hard flooring and 12 hours in silent mode, with a 4-hour charge cycle. This allows two-shift operation with a midday top-up.
Max mapping area. This defines how large a space the robot can memorize in a single deployment. A 40,000 ㎡ mapping capacity — as found on the SW80-A — covers most single-building warehouses and exhibition halls without requiring zone splitting.
Floor compatibility. The best commercial robots handle carpet, hard, and wooden floors without manual adjustment. Edge-cleaning performance and dust containment vary significantly between models, so request site demonstrations on your actual floor type before finalizing.
For facilities evaluating robotic cleaning system cost savings, the SW80-A's spec profile — 850 mm cleaning path, 17 kPa vacuum, ≤62 dB(A) noise, multi-floor compatibility — positions it for medium-to-large commercial and industrial applications. Its ability to transition between carpet and hard flooring makes it suitable for mixed-use complexes where floor types change between zones.
How much can a robotic cleaning system save per year?
Annual savings typically range from 40,000 to 120,000 for facilities above 20,000 ㎡, depending on current labor costs and shift structure. The largest savings come from eliminating one or more cleaning shifts.
Do robotic cleaning systems work on all floor types?
Most commercial models handle hard floors, carpet, and wooden surfaces. Performance varies on textured or porous floors. Always verify with a site test, especially for industrial coatings or anti-slip surfaces.
How long does it take to see ROI on a robotic cleaning system?
Standard payback periods fall between 12 and 24 months. Facilities with high labor costs and large floor areas reach break-even fastest. Secondary benefits like audit logs and reduced injury claims improve the effective ROI.
What maintenance do robotic cleaning systems require?
Routine maintenance includes brush replacement, filter cleaning, dustbin emptying, and battery health checks. Most manufacturers offer service contracts. Annual maintenance costs typically run 5–8% of the system purchase price.
Can a robotic cleaning system replace all manual cleaning staff?
No. Robots handle open-floor routes efficiently, but stairs, tight corners, and vertical surfaces still require human cleaners. The most cost-effective model is a hybrid setup where the robot covers large areas and manual staff handle detail work.
CONTACT US
we aim to become a global leader in manufacturer space service robotics and artificial intelligence.


